Presentation Development 101: Storyboarding, Slide Design, Graph Selection

This article discusses slides taken from a strategy consulting presentation on Presentation Development (Storyboarding, Slide Design). You can download the full PPT here.
This presentation focuses on the essential skill of developing effective business presentations, a crucial competency for consultants and executives alike. It delves into methodologies commonly employed by leading management consulting firms, emphasizing the importance of clear communication through structured presentations.
The framework outlined in the document is based on a 3-part approach: storyboarding, slide structuring, and graph design. It introduces a 6-phase problem-solving process to guide the creation of storyboards, ensuring that the presentation narrative is coherent and impactful.
The presentation also addresses practical concerns, such as maintaining consistency in design and delivering concise messages that resonate with audiences.
Mastering Storyboarding for Effective Consulting Presentations

The slide introduces storyboarding as a fundamental skill for consultants, emphasizing its importance in structuring analysis. It asserts that storyboards should be developed before any analysis begins, countering the common belief that analysis should come first. This approach allows consultants to frame their research effectively from the outset.
Storyboards act as a guiding framework throughout the analysis process. As consultants create storyboards, they may uncover gaps in their analysis, prompting necessary adjustments. The slide also highlights that the strength of the storyboard, rather than the length of the presentation, dictates the overall effectiveness of the communication. A well-crafted storyboard should convey its message without requiring verbal explanation, indicating a strong storytelling approach.
Mastering storyboarding is not instantaneous; it requires time and practice. Developing this skill is essential for any consultant aiming to enhance their presentation capabilities and ensure clarity in their messaging.
Read a more in-depth analysis of this PPT slide here.
Structured Approach to Problem Solving Process

The slide presents a structured six-phase problem-solving process, focusing on the initial 3 steps. The first step, “Define the problem,” is crucial for establishing a clear understanding of the issue. This clarity sets the stage for effective analysis and solution development. The second step, “Structure the problem,” organizes the identified issues into a coherent framework, allowing for systematic prioritization and addressing of challenges.
The third step, “Develop the analyses to test the issues,” is vital for laying the groundwork for deeper investigation. By this phase’s conclusion, enough information will be available to create a storyboard, which visually represents the problem-solving journey. This aids in communication and alignment among stakeholders, enhancing the overall effectiveness of the process.
Read a more in-depth analysis of this PPT slide here.
Framework for Defining and Addressing Business Challenges
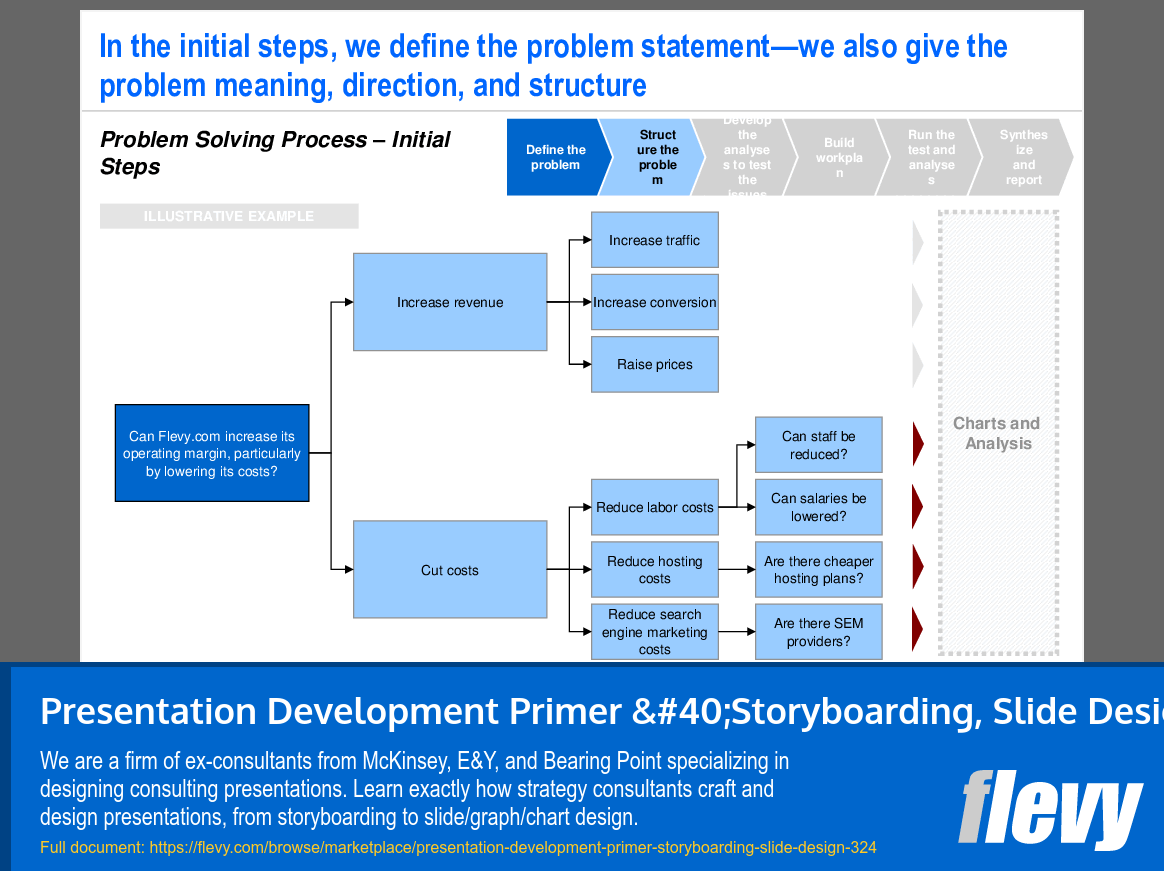
The slide presents a structured approach to problem-solving, focusing on defining the problem statement. It highlights the need to grasp the problem’s meaning, direction, and structure, specifically questioning whether Flevy can improve its operating margin through cost reduction.
A flowchart outlines 2 main strategies: increasing revenue and cutting costs. For revenue enhancement, tactics include increasing traffic, improving conversion rates, and raising prices. On the cost-cutting side, the slide identifies areas such as labor costs, hosting expenses, and search engine marketing, with probing questions aimed at uncovering potential efficiencies.
This structured framework serves as a roadmap for addressing the identified problem. It guides stakeholders through a logical progression, from problem definition to actionable solutions, facilitating a comprehensive analysis of financial performance opportunities.
Read a more in-depth analysis of this PPT slide here.
Transforming Insights into Actionable Strategies
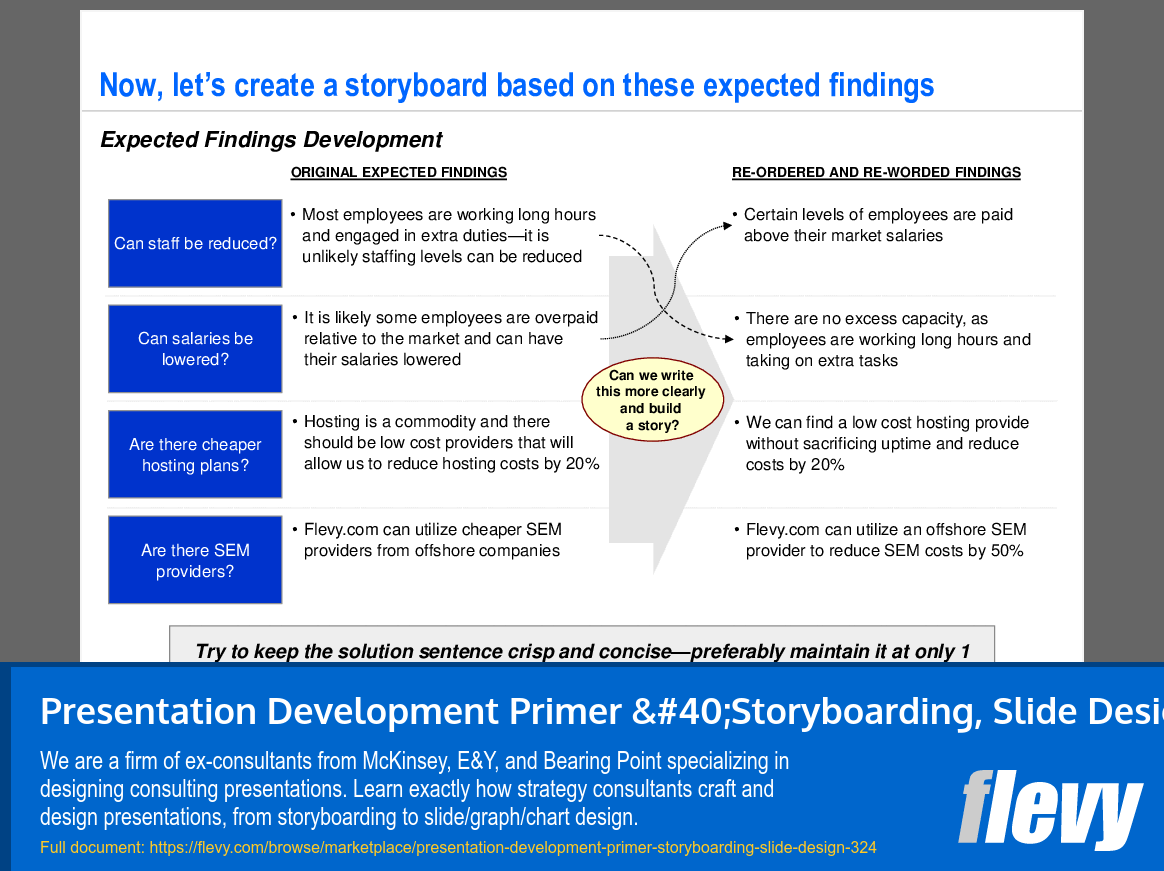
The slide outlines a methodical approach to developing expected findings for a consulting project, divided into 2 sections: “Original Expected Findings” and “Re-Ordered and Re-Wordered Findings.” This structure illustrates the transition from initial assumptions to more nuanced conclusions, emphasizing the refinement of insights over time.
In the original findings, 4 critical questions are posed regarding staffing, salaries, hosting options, and SEM providers. Each question is paired with an initial analysis, such as the observation that staff are overworked, making reductions challenging, and that some salaries may exceed market rates, indicating potential for adjustment.
The re-ordered section presents these insights in a clearer narrative, highlighting actionable strategies. It suggests identifying low-cost hosting providers without sacrificing quality and leveraging offshore SEM providers to achieve significant cost reductions. This approach underscores the importance of clarity and storytelling in consulting, facilitating effective communication with stakeholders.
Read a more in-depth analysis of this PPT slide here.
Insights on Employee Compensation and Cost Reduction Strategies
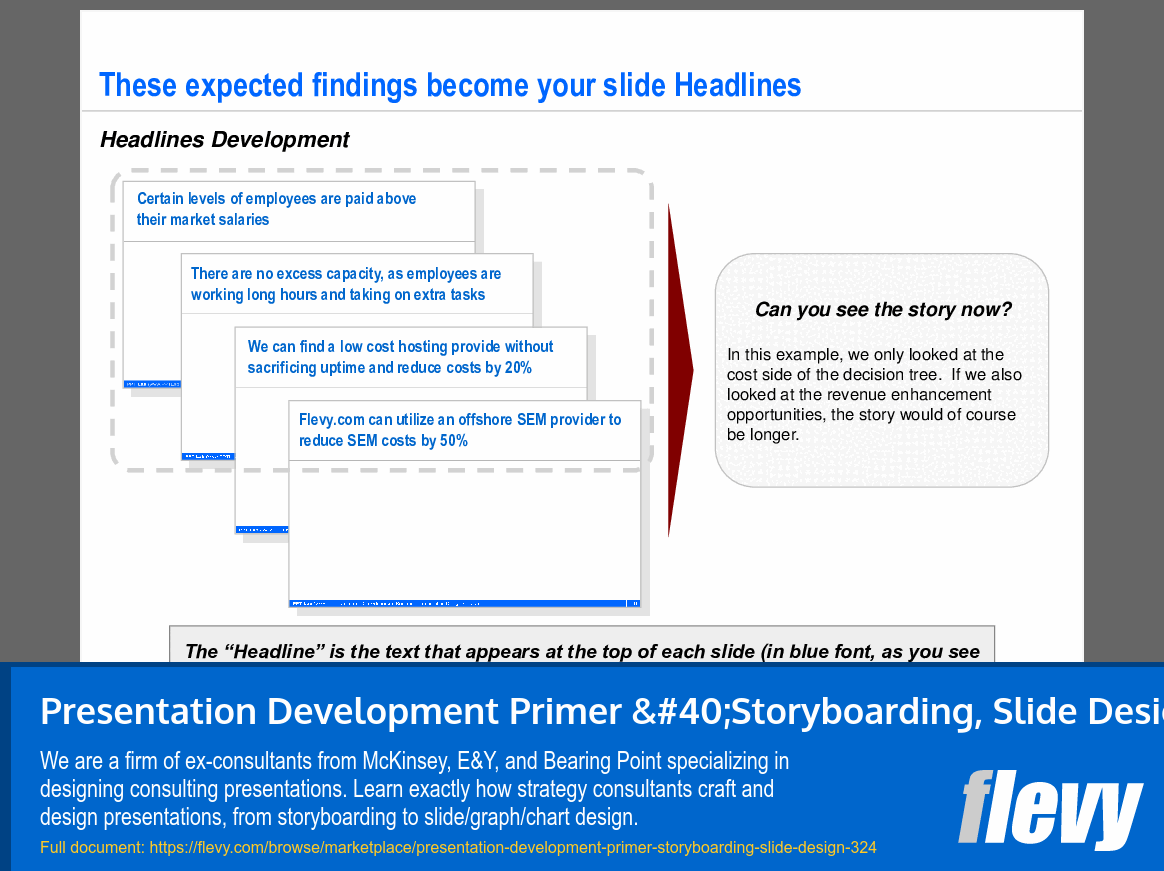
The slide addresses the formulation of impactful headlines for presentations, emphasizing how anticipated findings can guide the narrative. It highlights that some employees are compensated above market rates, indicating a potential misalignment with industry standards that warrants review. Additionally, the absence of excess workforce capacity suggests employees are overextended, which could lead to burnout and inefficiencies.
A proposed strategy for cost reduction includes sourcing a low-cost hosting provider that maintains uptime, potentially cutting costs by 20%. Furthermore, leveraging offshore SEM providers could lead to a 50% reduction in SEM expenses. This dual focus on cost management illustrates a proactive approach to optimizing expenditures while also hinting at the need to explore revenue enhancement opportunities for a more comprehensive strategic outlook.
Read a more in-depth analysis of this PPT slide here.
Essential Components of Effective Presentation Slides
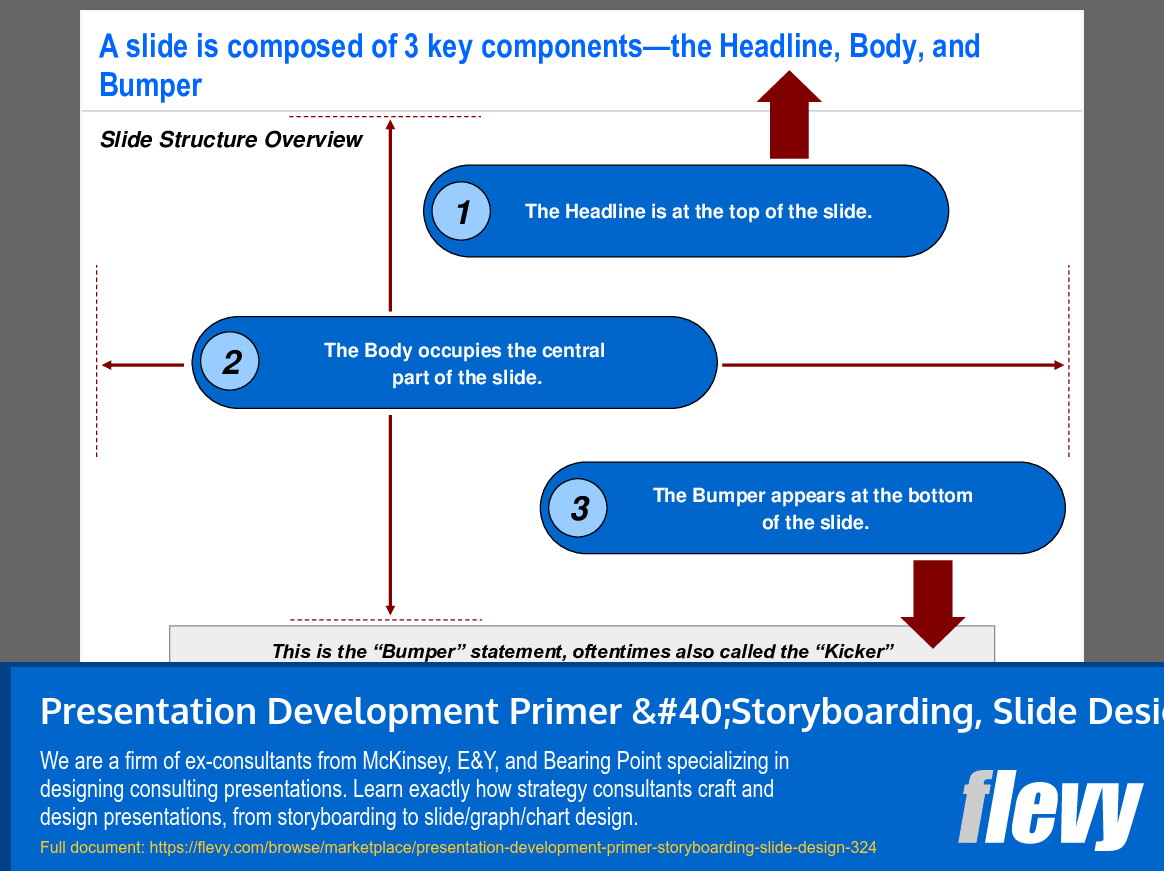
The slide outlines 3 essential components of an effective presentation slide: the Headline, the Body, and the Bumper. Each element is clearly defined, offering a straightforward framework for constructing slides that communicate effectively. The Headline, placed at the top, captures attention and sets the context for the content that follows.
The Body occupies the central area and contains the main content, which is crucial for delivering insights or arguments that support the Headline. Its clarity and organization are key to ensuring the audience comprehends and retains the information presented. At the bottom, the Bumper serves as a concluding statement or call to action, reinforcing the key message and leaving a lasting impression.
Understanding these components is vital for anyone aiming to enhance their presentation skills. A structured approach can significantly improve communication effectiveness, making this slide a valuable resource for professionals seeking to refine their presentation techniques.
Read a more in-depth analysis of this PPT slide here.
Crafting Effective Titles for Graphical Data
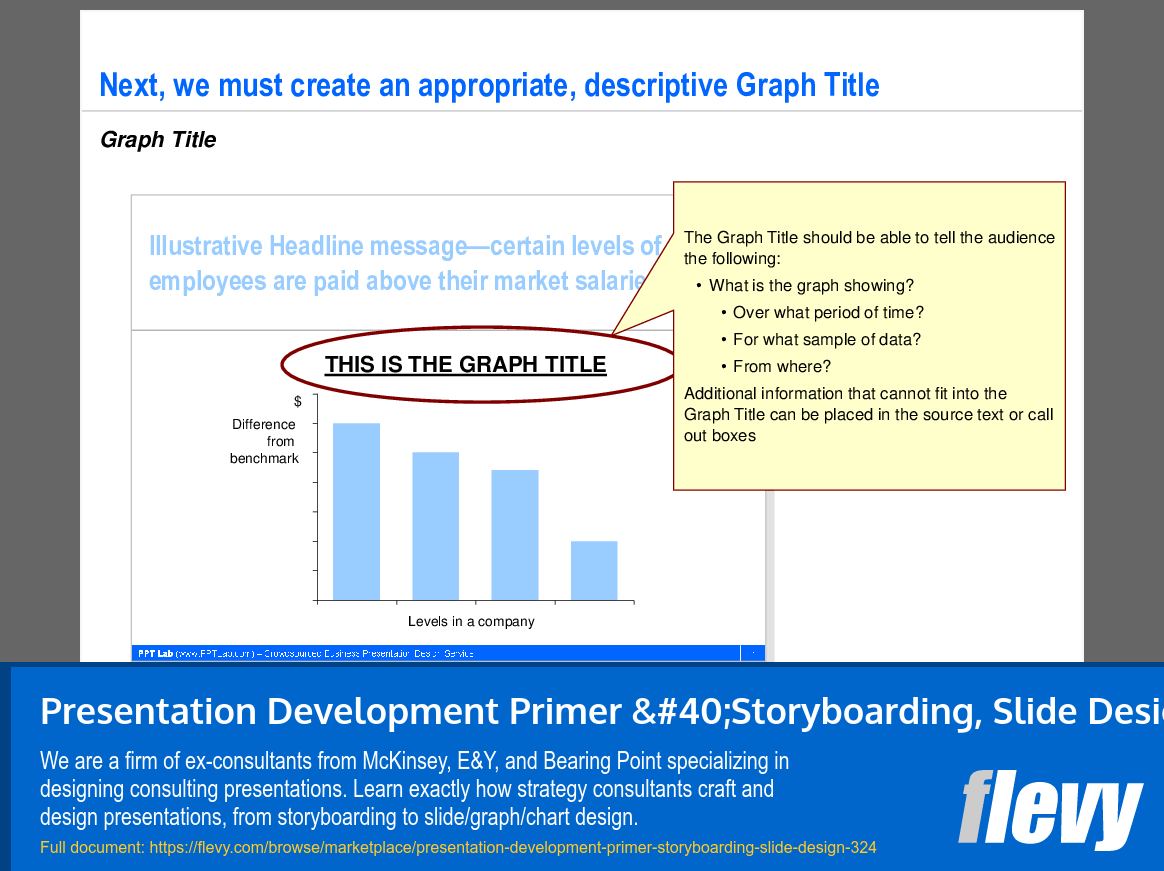
The slide focuses on the necessity of a clear and descriptive title for graphs. It highlights that the title should effectively communicate what the graph illustrates, the time frame of the data, the specific sample being analyzed, and the source of the information. This clarity enables the audience to quickly understand the context and significance of the data presented.
The graph itself shows differences in employee salaries compared to a benchmark, segmented by various levels within a company. The placeholder title, “THIS IS THE GRAPH TITLE,” indicates the need for customization to reflect the actual content and insights. Additional details can be provided in the source text or call-out boxes, allowing for a more thorough understanding without cluttering the title.
